
Greg, What Does Your Planning Look Like?
Greg, What Does Your Planning Look Like?

Yes, I take my own medicine. As proof, I spent the weekend applying some of my ideas to recapping 2016 and looking ahead to 2017. Specifically, I'm planned my flow of business for next year. I use this map, which you may have seen before.
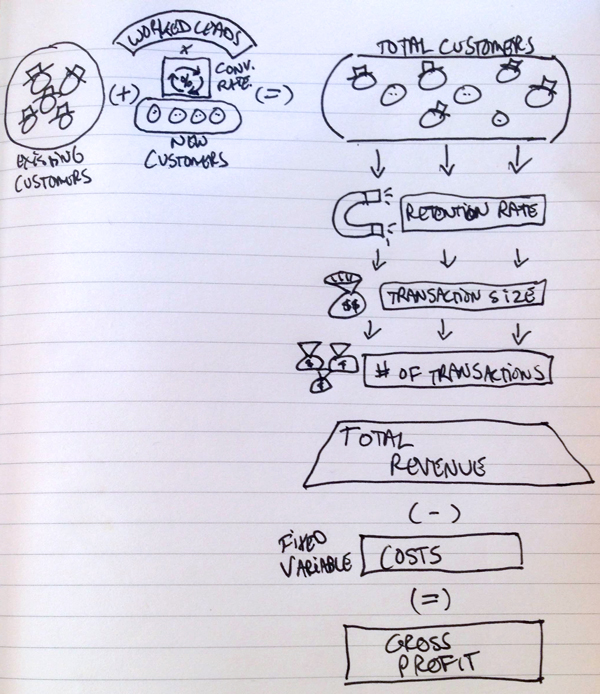
The map isn't complicated. 2017 is going to include some existing business, some new business (made up of leads multiplied by my conversion rate), a percentage of those projects will come to fruition, I have an average transaction, I have multiple projects per customer, that all adds up to revenue and I'll incur some costs. I keep what's left over.
In using it with clients,I find it's helpful to put parameters on each element because the gray areas are what gives a business it's color and personality. It's where FIT lives. That's what the rest of this article is about. I want to share some examples of the parameters put on each element.
Each element in the map generates a series of questions. In answering those questions, take a moment to think about what a good number or ratio would be before you make a planning decision based on the number. Let me show you one.
Starting with Existing Customers in the upper left and looking at Retention Rate, I need to know that number. What percentage of last year's customers do I expect to come along with me in 2017? Before I look at my actual results from 2015-2016, I put my parameter in place.
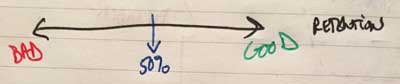
In my business, if my retention is less than 50%, it's a sign that I'll need to fix it, make some changes in 2017. If it's over 50%, I can prioritize other elements.
Make sense? Sometimes the numbers are simple like that, like a teeter-totter, one side is good and the other is bad. Other ratios aren't quite so cut and dry.
Let's take a sub-ratio of my total revenue for instance. What is the percentage of revenue that came from new customers? Important because I'm looking for an indicator that my new business efforts are working.
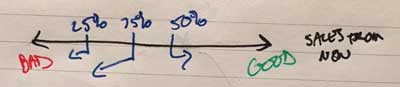
For me, if it's less than 25% of revenue that comes from new customers, I need to get busy with prospecting. That must make anything more than 25%, good, right? Ideally, 50% of my sales is coming from new customers because that means I'm growing and evolving. But what happens if the number is over 75%? That's bad too because it means I'm out of balance the other way. I'm not taking care of existing customers. That's what I mean by gray area.
The beauty of these number lines and labeling "good" and "bad" is that it starts conversation. Even if it's only between me and Wilson the Amazing Border Collie.
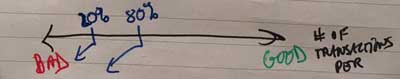
Here are some other ratios and my indicators:
Growth of the number of transactions per customer:
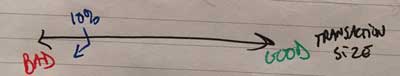
The growth of average transactions:
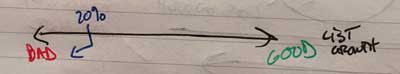
The growth of my list:
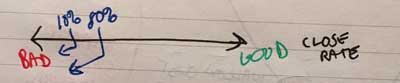
What's my close rate:
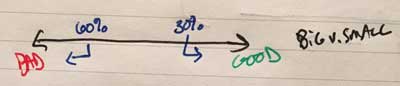
What percentage of my revenue came from my three largest customers?
Does that help? Knowing the ratios is important, but knowing where you want them to be is your unique fit. Once the ratios are calculated, get your team to discuss what a good ratio is and what a bad ratio is. Spend some time talking about the gray area. Ideally, before you plug numbers in, and definitely before you start prioritizing the plans for 2017.
What gets measured, gets managed. We all know that. These exercises will help you with management.
Good stuff.