Facebook, Google Adwords, Analytics and the Power of Impressions
What’s the ROI?
The beauty of our wired world, as my techie friends will tell you, is that once our activities are reduced to bits and bytes, we can track anything. Think about it. I am logged into Google+, my browser is a cookie monster, and when I’m on your site you know how long I’m on the site, what page I go to next, where my eyeballs track. It’s cool, mon. Like magic.
As a marketer, that means I can track my ad spend, my sources, my sales and wrap it all up into a nice package for the CFO.
Real life isn’t so clean.
I have spent an inordinate amount of time working on systems that tie marketing and my customers together. Hooks are set, rules are engaged and reports are run. And what happens?

Me reading report: “How did I lose 22% of my transactions? Ok, we’ll tweak it for next month. . . oops, 13% still not assigned. 27%, 6%, 12%.” The data is everywhere.
So I gave up. Well. . .kind of. I did what I usually do. I let it sit and kept working on the real target – top line growth. Maybe some other numbers will pop out.
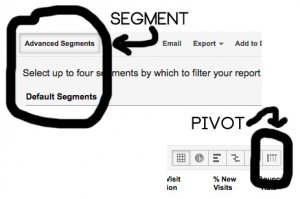
In Google Analytics, there’s a great feature called Segmentation. Couple that with the Pivot function and you can plot multiple data points against one another.
So I can track online transactions versus something like Facebook traffic. Or pull it offline and track transactions against Facebook Ad spend.
Why would I go there? Because my Facebook transactions make it look like the money I spend there is a vacuum. The engagement #s that look so impressive on my Facebook Insights don’t translate to revenue in Analytics.
I begin to hate Facebook. F’n hoodie.
But the Pivot table showed my revenue did track with the Facebook spend. When the ads hit, traffic went up – direct and Adwords/Organic for my keyword – and when traffic increased, revenue increased.
And that is why I started monitoring Cost Per Acquisition each month at the macro level –
CPA = (Marketing Spend / # of New Customers).
It was the only way to make sense of the sausage making that was going on inside the day to day. It was just like the pre-internet days. . .“50% of my marketing spend is effective. I just don’t know which 50%.”
So, armed with that knowledge, I encourage you to look at Facebook and Google Adwords placements and consider whether or not you can get a boost from the Power of Impressions to help your business.
I know, you’re thinking “Really?”
Yes – where else can you target by ZIP, gender, and interest? For instance, men in 80237 who are fans of Morrissey/The Smiths?
Yep. There are 80 of them.
How much is it to create a “display” ad that will only show to those people? Not much.
Especially when compared to what an ad in the Denver Post runs for a 1/32 size ad in that area. Single shot.
That same approach can be applied to Adwords – generally for search phrases that are focused on the “problem” and not the “solution”. Like “sharp pain in my shoulder” versus “chiropractors in tucson”. Less competition and a chance to get your name in front of people that will eventually be looking for a Solution that you offer.
I know. . .it’s a big process but it works.
The biggest challenge? Communicating the effectiveness to the boss. She/he’s bombarded by the geeks who say “and you can track it, manage it and get a positive ROI”. You need to change the conversation. Like Marsellus might say, “Ima get Macro on your ass”

Marsellus helps you manage your boss
Good stuff.


